


One of the main reasons why most Forex traders lose money is a failure to trade based upon longer-term, higher time frames such as the weekly time frame. This article explains why and how to use the weekly time frame in your Forex trading, and outlines both rules and actual historical performances of a few weekly time frame trading strategies which you might use or adapt.
What is Time Frame in Forex Trading?
“Time frame” in Forex trading means the unit of time that the price chart you are viewing is based on. For example, in a weekly time frame Japanese candlestick chart, each candlestick represents one week of time. In a 5-minute time frame Japanese candlestick chart, each candlestick represents 5 minutes of time. Shorter time frames show much more detail of price movement over time, but longer time frames show wider, longer-term pictures of trends and ranges in the price.
Why You Should Use the Weekly Time Frame in Forex Trading
The most effective, profitable, and powerful tool you can use to trade Forex is to pay attention to whether or not there is a long-term trend or range in any currency pairs or crosses, especially the major pairs; and if so, in which direction that trend is going. Then, make sure that you trade in the same direction as that trend, or trade reversals from support and resistance when there is no trend and the price is ranging. Use a higher time frame price chart such as the weekly time frame to make these calls.
While you can use a daily time frame chart for the same purpose, you should use the weekly time frame in Forex trading for this because it is easier to judge the very long-term price action at a glance there. It is also a good idea to drill down and use at least one shorter time frame chart as well, such as the 4 hour or hourly time frames, to fine-tune your trade entries and exits to make them more precise, which also means more profitable.
How to Measure Trend with the Weekly Time Frame
The reason why the weekly time frame is the best time frame for trading Forex is because historical Forex data shows that when the price is higher than it was several months ago, it is more likely to rise than fall, and vice versa when the price is lower than it was several months ago. So, if you pull up a weekly chart, one easy trick you can do to create the best trend indicator, is count back 13 and 26 weeks from the current weekly candlestick. Is the price now higher than it was at those times? If yes, you have a long-term uptrend. If it was lower at both, you have a long-term downtrend. If the results are mixed, you have no trend. Forget all the fancy Forex indicators – this is a method which is both very simple and effective.
For example, the weekly timeframe chart of the EUR/USD currency pair below shows the current weekly candlestick, on the far right, clearly below the opening prices of the candlesticks from 13 and 26 weeks ago. So, there is a clear downtrend, and this week traders can look for short trades in this currency pair.

Weekly Time Frame: Long-term Downtrend
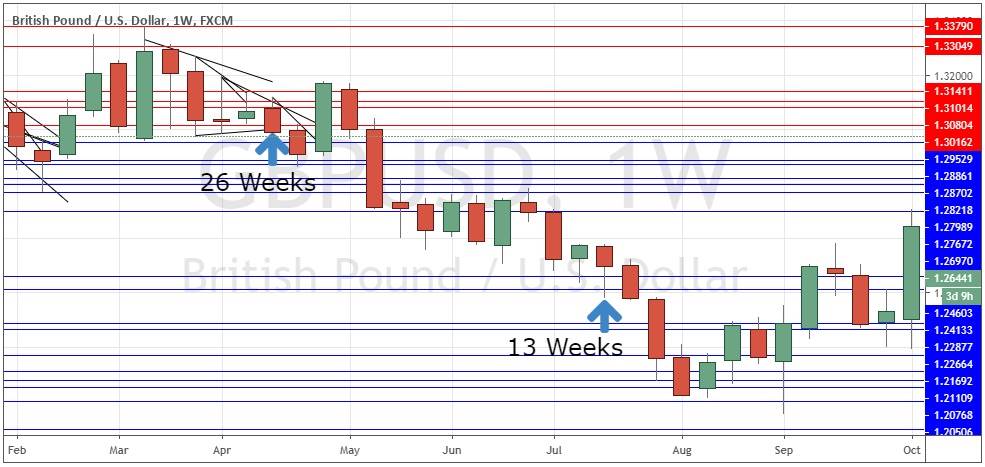
In another example, the weekly timeframe chart of the GBP/USD currency pair below shows the current weekly candlestick, on the far right, closing above the opening price of the candlestick from 13 weeks ago, but also below the opening price of the candlestick from 26 weeks ago. So, there is no long-term trend, and next week traders who want to trade this currency pair should look to trade reversals at support and resistance levels.
Weekly Time Frame: No Long-term Trend
Should You Use Only One Time Frame in Forex Trading?
Although a weekly time frame chart can show you a trading edge, in all except very limited circumstances (explained in more detail below in the “Trading Forex with the Weekly Time Frame Only” section), it is not smart to trade using the weekly time frame alone. In fact, using just a single time frame to trade Forex is usually a bad idea, whatever time frame you might pick. However, using higher time frames such as the weekly price chart, can at least tell you whether there is a long-term trend and if so, in what direction.
There are several reasons why trading using the weekly time frame alone is usually a bad idea:
- It is just too long-term and slow to use on its own. While you might easily hold a good trade open on a short time frame such as 5 minutes for fifty candles, if you try holding a trade open for 50 weeks, you will encounter many problems.
- Some Forex brokers impose a time limit on the duration of trades, forcing you to close an open trade after it has been open for typically a few weeks or months. Few brokers advertise this fact- you have to check the small print or ask the broker directly to find out..
- All Forex brokers, unless you have an Islamic Forex broker account, will either charge or pay you a small amount based on the size of your trade and the interbank interest (“tom/next”) rates of the respective currencies in the pair. Usually, it is a charge and not a credit – the system is biased against the trader and is a way Forex brokers can make money quietly from long-term traders. Even if the fee is typically small, such as a quarter of a pip per day, if you hold a trade open for a long time these overnight swap fees add up and can really eat away at your profit.
- Professional traders always use a combination of long-term and short-term time frames. Typically, professional traders will have three timeframe screens open for whatever they are trading showing the daily, hourly, and 5-minute time frame charts.
Multi Time Frame Trading with the Weekly Time Frame
Multiple time frame analysis is simply looking at two or more price charts for the same Forex currency pair or cross or other instrument, at the same time. You make a multiple time frame analysis by looking first at a higher time frame and using that chart to determine whether the price is trending (and if so, in what direction) or ranging, and also maybe to identify clear support and resistance levels. It is a top-down analysis, because once you have that information from the higher time frame, you then use a lower time frame to trade from that analysis, which will usually get you more precise trade entries and exits which should maximize your reward to risk ratio.
There are a few good Forex trading strategies which have historically been profitable on the weekly time frame, outlined below. You can use a shorter time frame as a tool to trade these strategies more effectively.
The results detailed below are from back tests conducted on sixteen major and minor Forex currency pairs over a very long period of almost 20 years, from 2001 to 2020. Thousands of samples were taken, increasing the statistical validity of the back test.


0 Comments